
Driving impact
Airtel Africa is positively impacting Africa's future
At Airtel Africa, we believe that to transform lives we must continue to expand access to digital and financial services that empower people, build resilience and unlock economic opportunities across the continent.
Through our investments in digital connectivity, mobile money and education, we’re helping to remove the barriers that prevent many people in Africa achieving their aspirations or reaching their full potential. And in doing so, we’re enabling more people – especially young people, women and rural communities – to build better futures for themselves and their families.
We're focusing on four areas where we have the most meaningful and lasting impact:
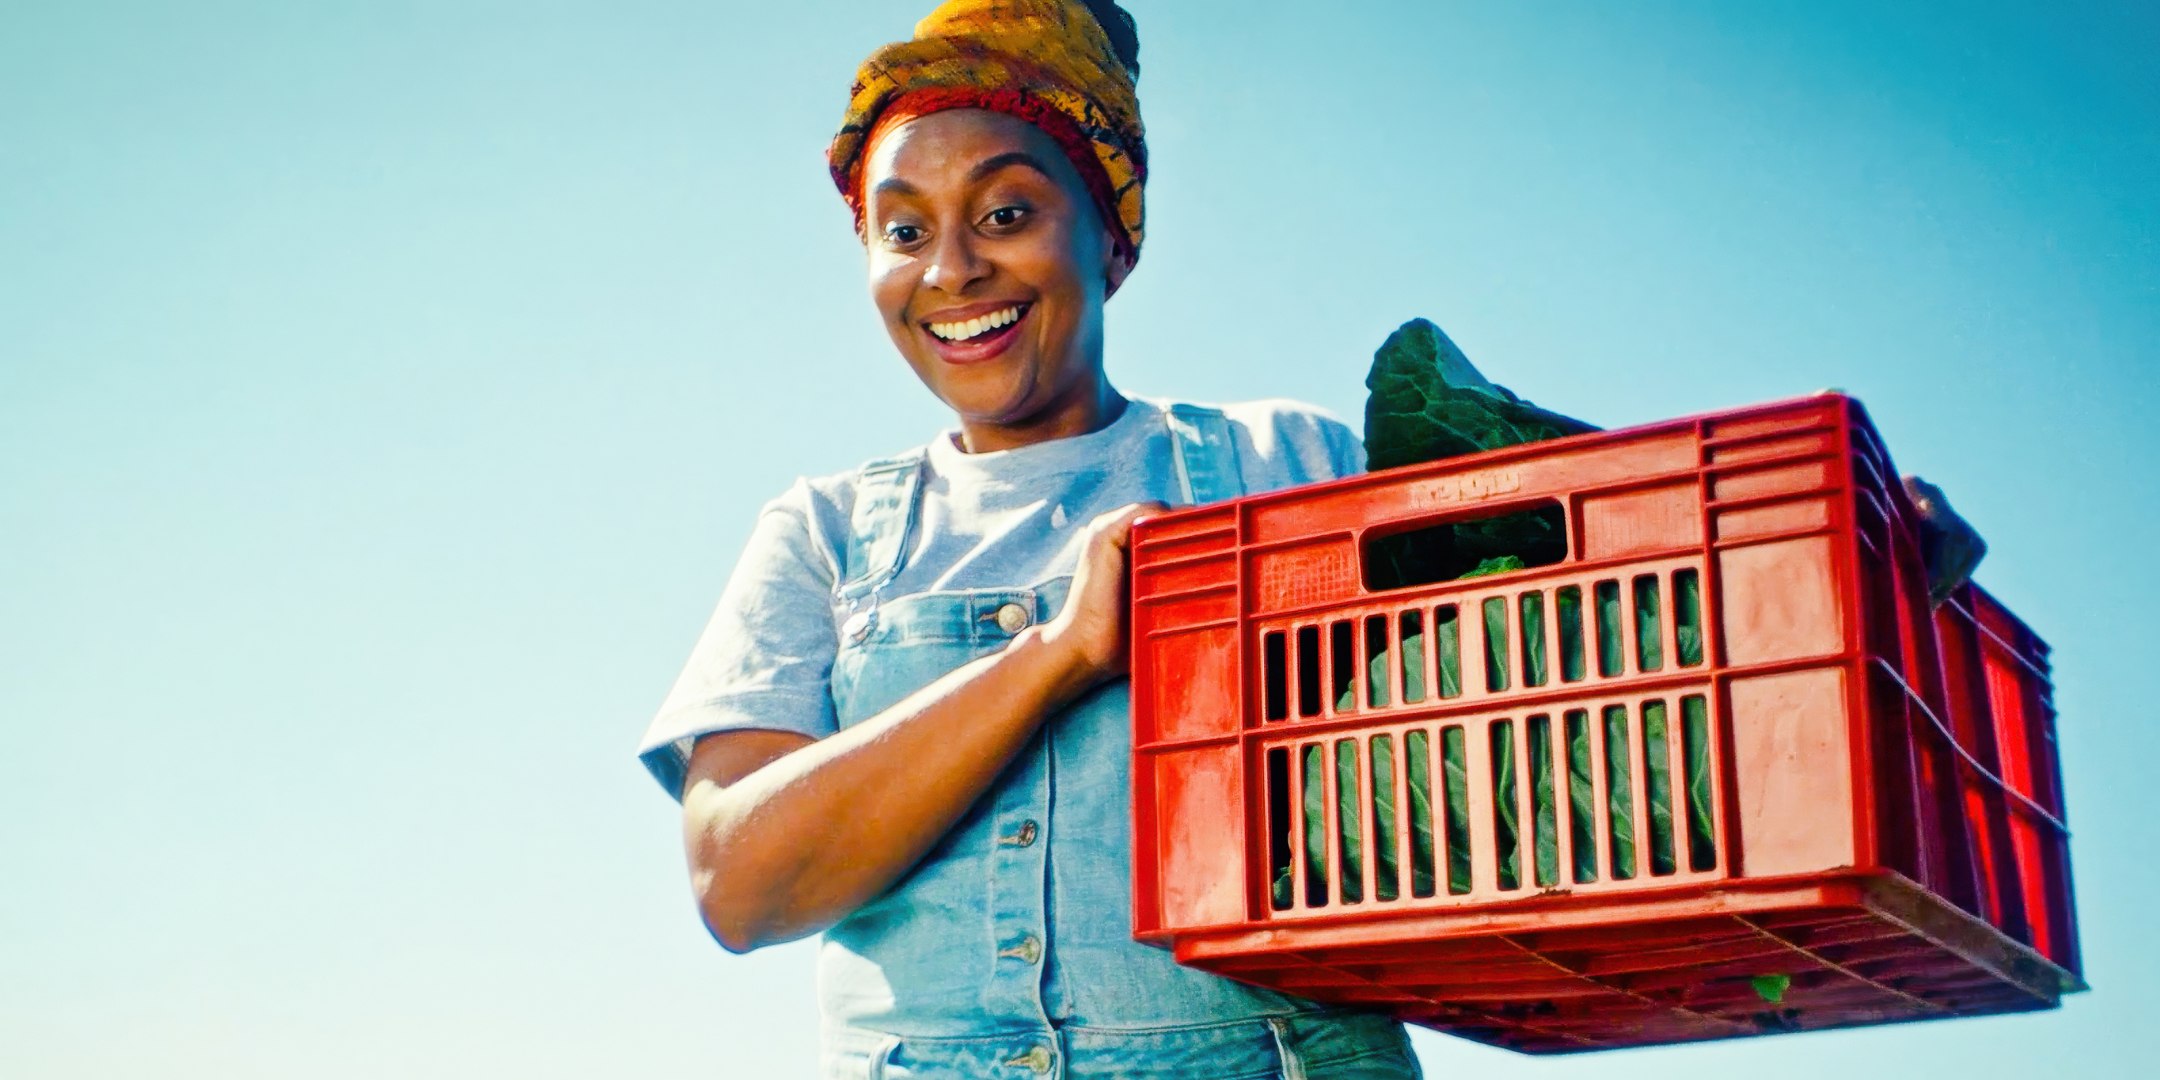
Contributing to inclusive economic growth
Bridging the digital divide
Driving financial inclusion
Supporting social development and environmental protection
1
Connectivity, digitisation and financial inclusion are transforming lives across Africa – and our strategy reflects a deep, long-term commitment to creating meaningful, sustainable change.
2
Sunil Taldar
Chief executive officer, Airtel Africa plc
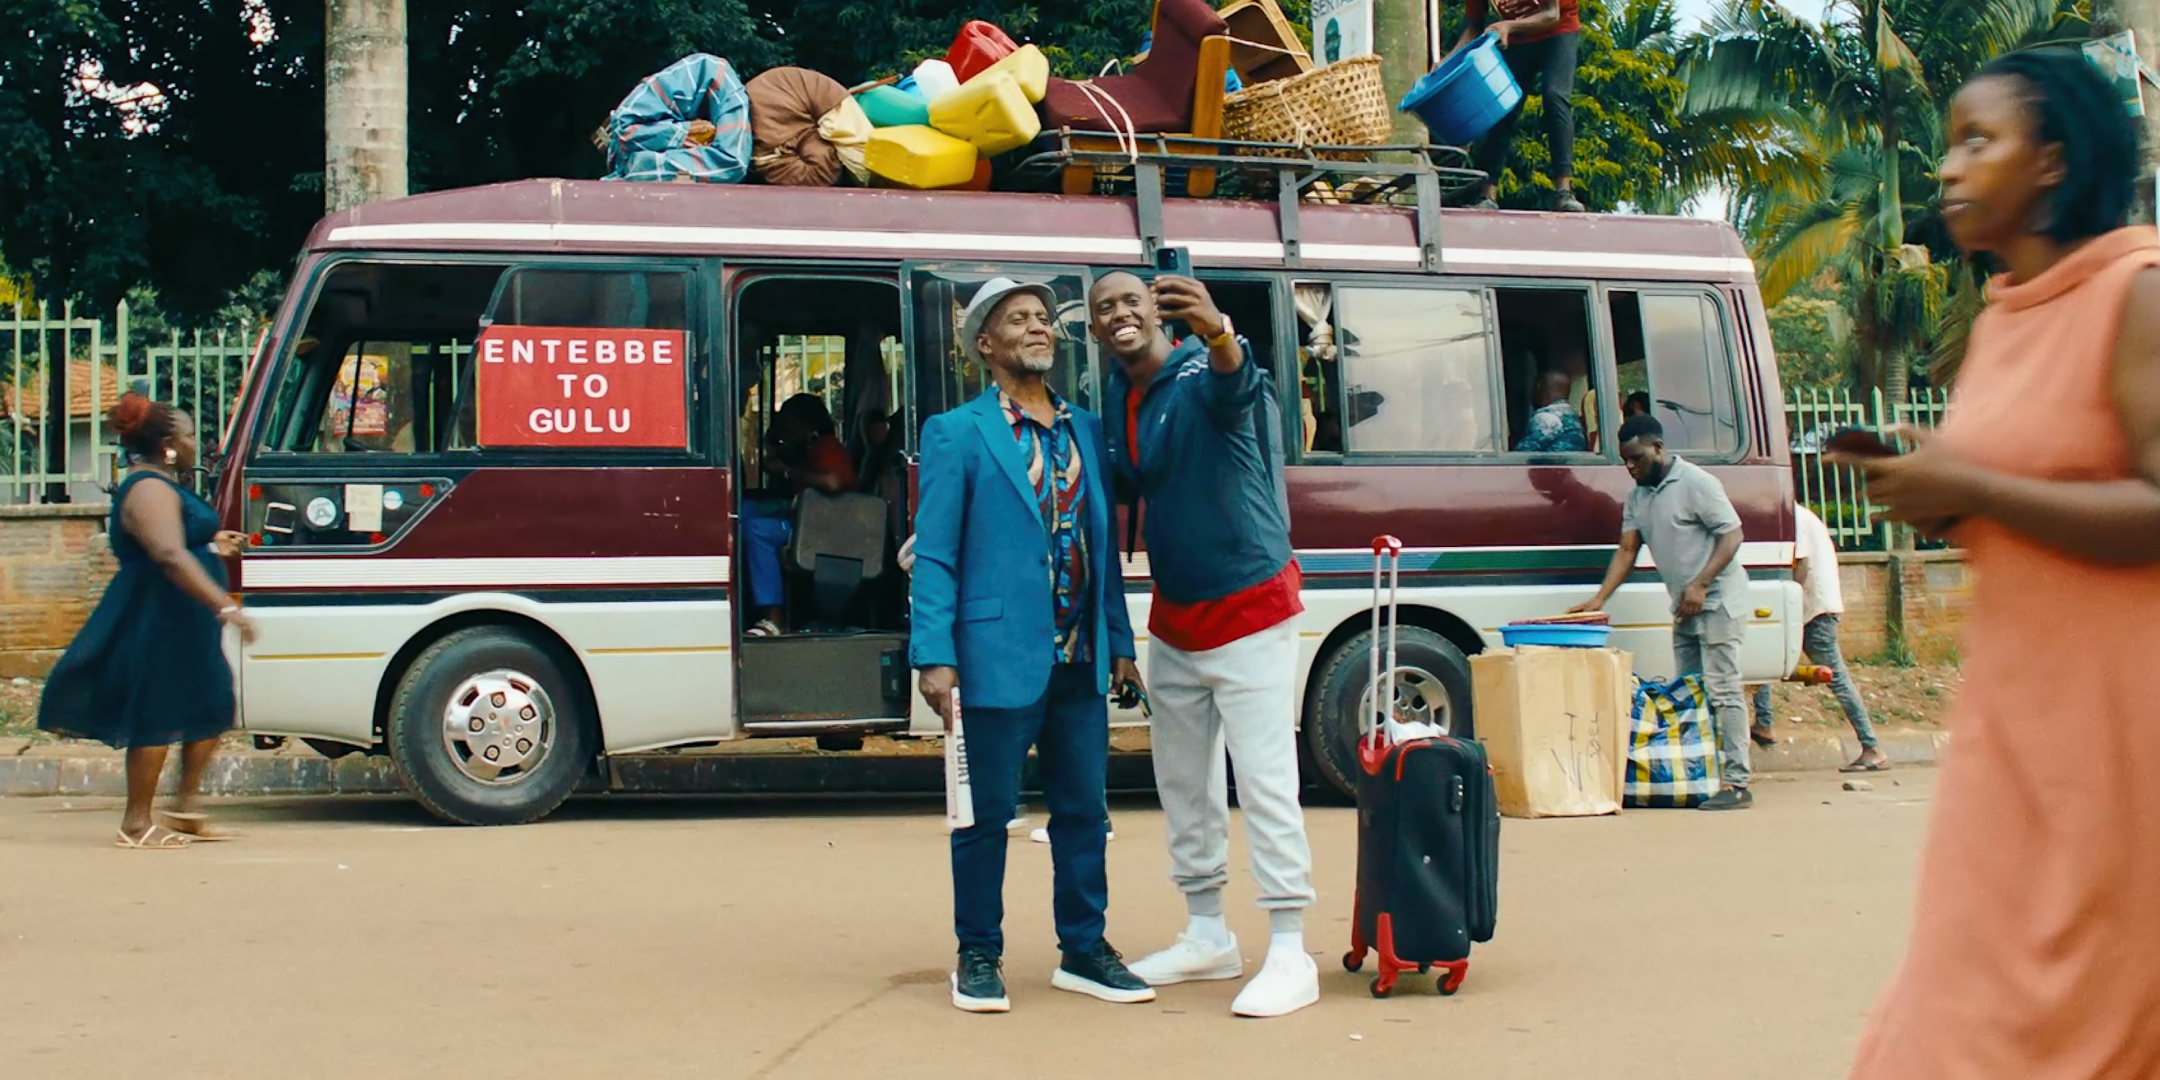
Contributing to inclusive economic growth
We believe that a connected society is a more resilient and prosperous one. Our investments in infrastructure, engagement with local supply chains and digital business ecosystems are creating opportunities for employment, entrepreneurship and innovation at every level.
In 2024/25, our total capex investment of $670m enabled us to focus on strengthening service quality, reliability and reach. From the rollout of 5G and fibre to upgrading tower sites in the DRC, Kenya and Uganda, we’re laying the groundwork for a truly inclusive digital economy.
This year, we supported approximately 1.7 million Airtel Money agents serving their communities. Our presence contributes to national economies, particularly in rural and hard-to-reach areas, where digital infrastructure is helping to reduce inequality and increase resilience.
We also contributed approximately $1.7bn in tax revenues to support public services and economic recovery across our 14 markets. These fiscal contributions help governments deliver healthcare, education and local infrastructure – extending our impact far beyond telecommunications.
According to GSMA's Mobile Economy Report, mobile technologies contributed 7% of GDP in sub-Saharan Africa in 2023. Airtel Africa is proud to be helping power this transformation.
SDG 8: Decent work and economic growth
SDG 9: Industry, innovation and infrastructure
Capex Investments
Annual capex investments
Aligned with: UN SDG8 Decent work and economic growth and UN SDG9 Industry, innovation and infrastructure
Employment impact
Number of Airtel Money agents in our distribution ecosystem
Aligned with: UN SDG8 Decent work and economic growth
Direct and indirect contribution
Total direct and indirect contribution (including taxes) by the Group in 14 markets
Aligned with: UN SDG8 Decent work and economic growth
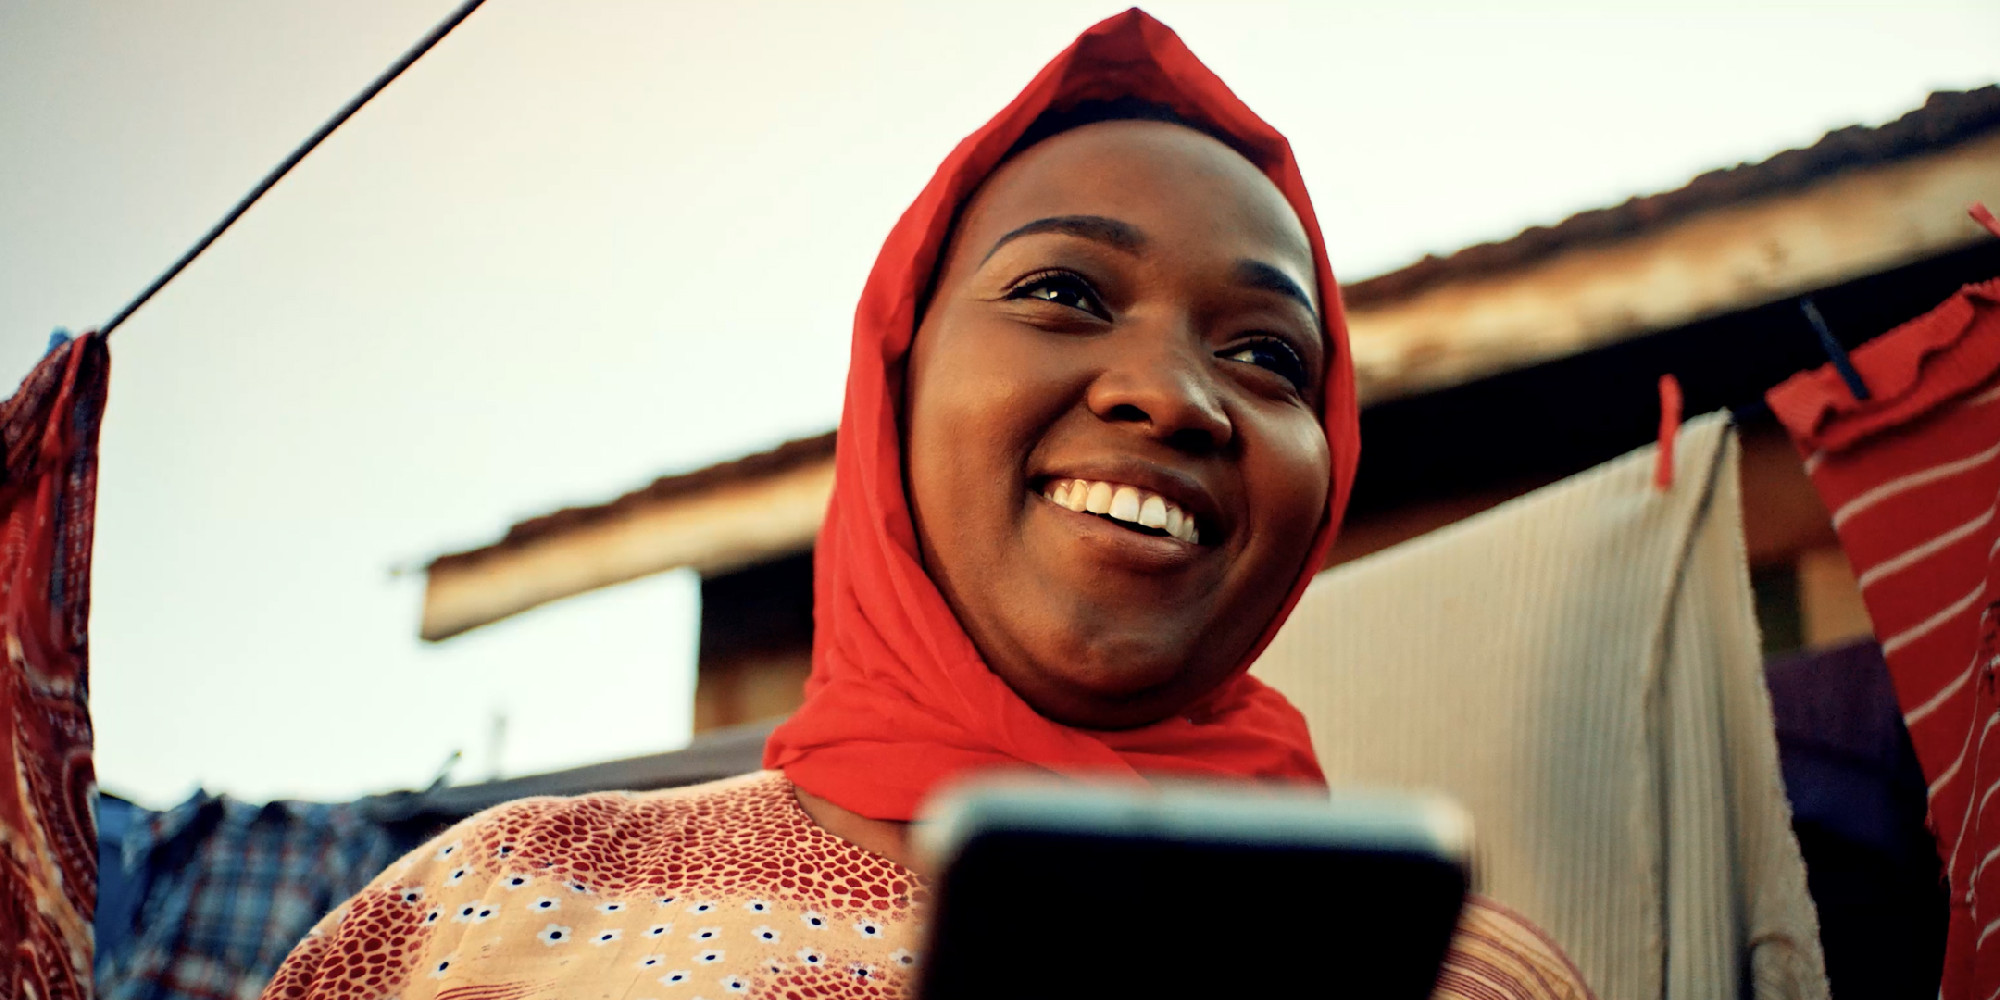
Bridging the digital divide
Many of the countries where we operate are among the world’s least connected to mobile technology. With rapid population growth, millions of people across Africa still lack access to the digital tools. Bridging the digital divide means more than expanding coverage – it means addressing affordability and digital literacy so that everyone has the chance to participate.
We're also tackling affordability. Through handset financing schemes and tailored data bundles, we’re making it easier for low-income users to get connected and stay connected. This focus is having a positive impact with data customer penetration up to 44.2% and smartphone penetration reaching 44.8% in 2024/25, both continuing an ongoing upward trend. For each of these impact metrics, every percentage point represents thousands of people gaining access to education, healthcare, information and community.
Our digital literacy campaigns are also helping close the gender gap in internet access. More women and girls are learning to use digital tools safely and confidently – enabling greater independence, economic participation and connection ensuring no one is left behind.
SDG 9: Industry, innovation and infrastructure
SDG 10: Reduced inequalities
Network coverage
Percentage of population covered
Aligned with: UN SDG9 Industry, innovation and infrastructure
2G/3G
4G
Data customer penetration
Percentage of customers using data services
Aligned with: UN SDG9 Industry, innovation and infrastructure
Smartphone penetration
Percentage of customers using smartphones
Aligned with: UN SDG10 Reduced inequalities
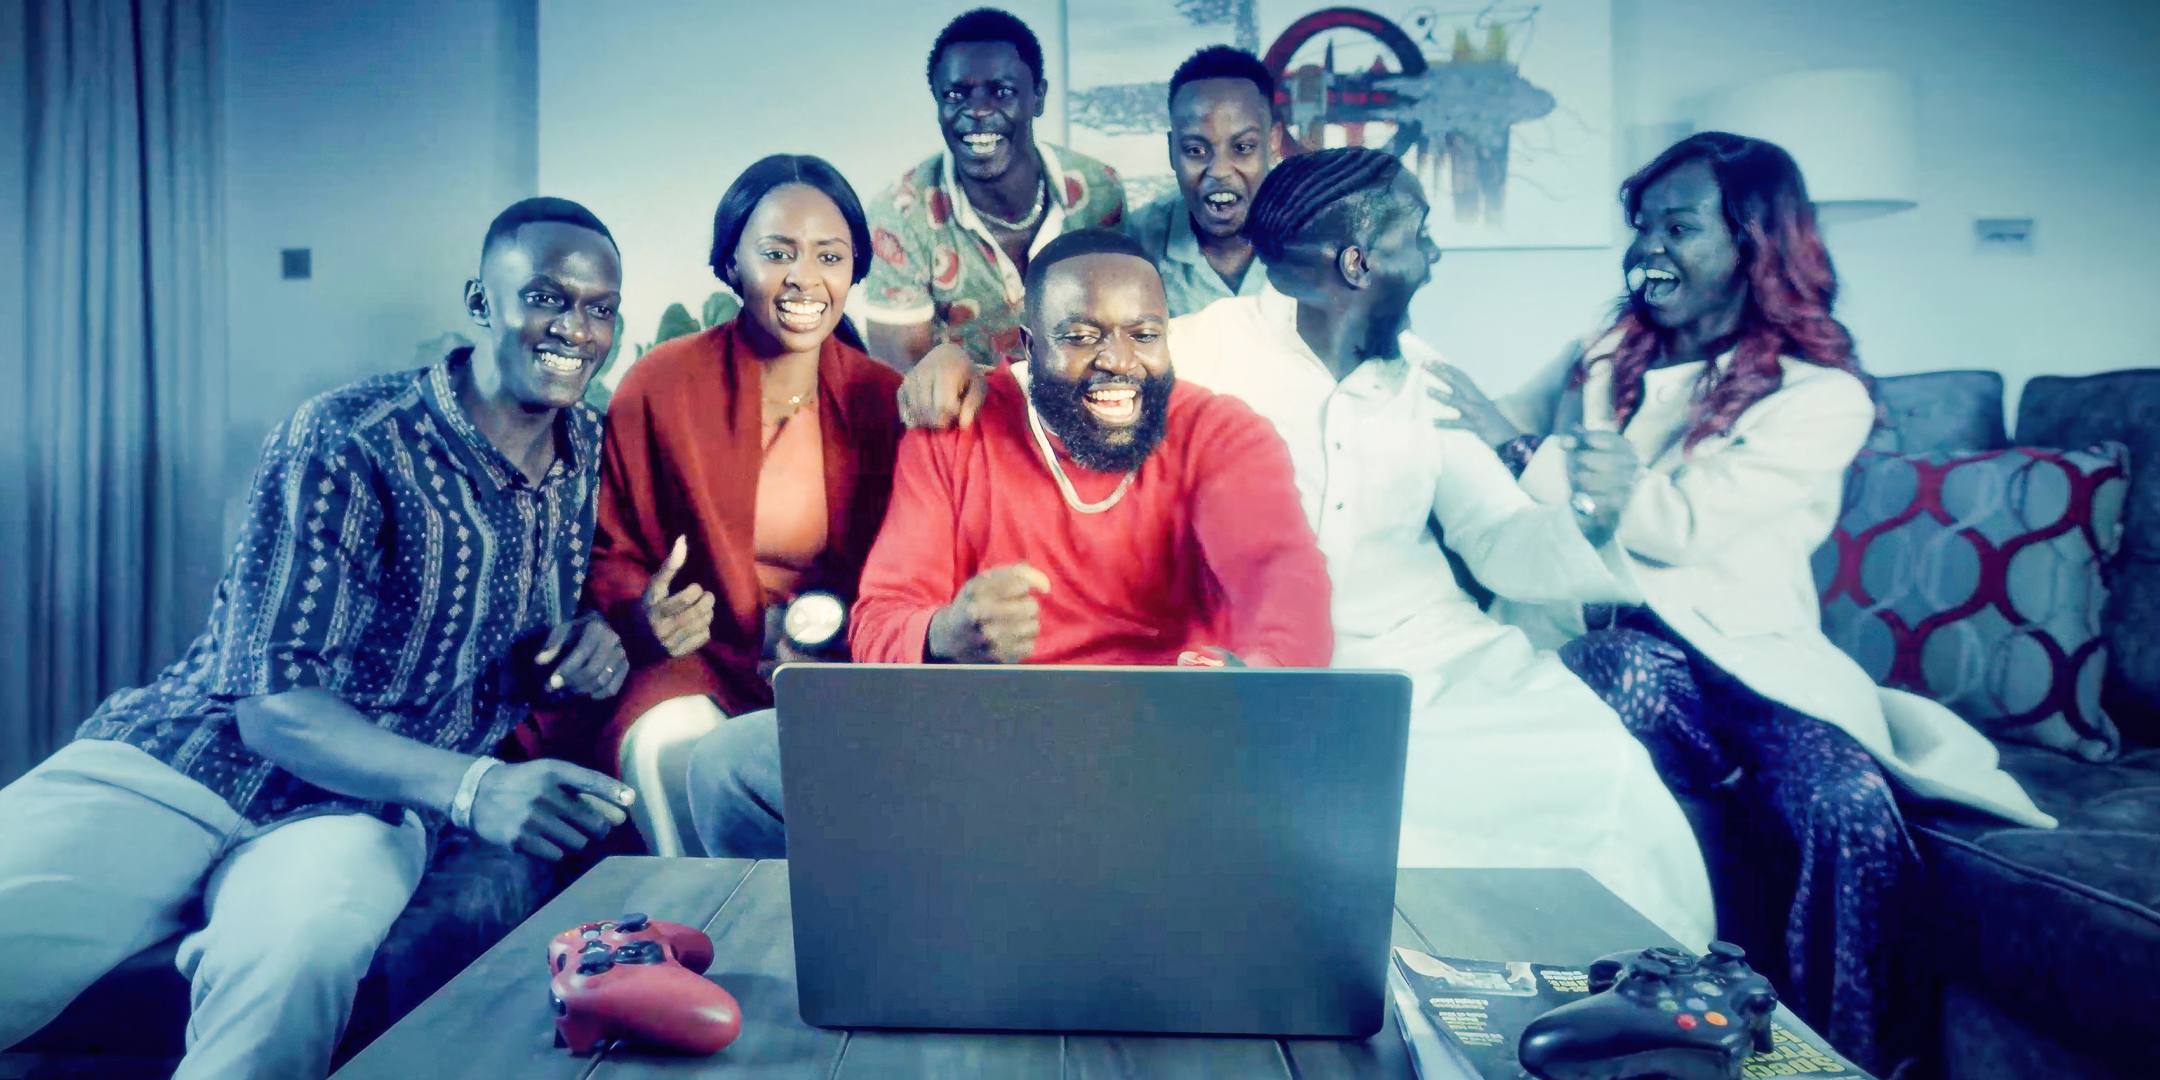
Driving financial inclusion for all
Financial inclusion gives people agency, dignity and control. It provides them with the tools to invest in their future and support their communities. It's a core part of our strategy, and one of the most powerful tools we have for driving equitable development across Africa.
Across our markets, millions of people still lack access to formal banking services. Airtel Money is changing that. It provides a safe, affordable and accessible entry point to the financial system for everyone, including farmers, informal workers, women-led enterprises and small traders.
In 2024/25, we served 44.6 million Airtel Money customers – offering secure transactions, savings, credit and insurance services. Over the year, we processed more than 17 billion transactions, amounting to $136bn in value. Our growing customer base demonstrates how quickly trust and adoption can florish when services are developed around people’s real needs.
We are particularly proud of the role Airtel Money plays in gender inclusion. In 2024/25, 44.2% of Airtel Money customers were women.
SDG 5: Gender equality
SDG 10: Reduced inequalities
Airtel Money customers
Total number of registered and active users
Aligned with: UN SDG10 Reduced inequalities
Mobile money transactions
Transaction value in Airtel Money ecosystem
Aligned with UN SDG10 Reduced inequalities
Airtel Money women customers
Percentage of Airtel Money women customers
Aligned with: UN SGD10 Reduced inequalities
Supporting social development and environmental protection
Through the Airtel Africa Foundation, we’re building human capital and expanding access to digital education for young people. The landmark five-year $57m partnership with UNICEF continues to connect schools and deliver digital literacy programmes across 13 markets. In 2024/25, 2,176 schools were connected to the internet, offering free data access and enabling thousands of students to participate in online learning.
Gender equity is also central to our social agenda. While the percentage of women in our workforce is growing and stands at 29.2% across the Group, and 28.5% of our OpCo Executive Committee (ExCo) roles are held by women, driving this forward is a key imperative for us. Programmes such as the global talent accelerator and the mobility programme help to build a more diverse and inclusive leadership pipeline, while cross-market assignments foster shared learning and professional growth.
As confirmed by GSMA's mobile for development platform, collaboration is key to long-term impact. That’s why we work alongside governments, NGOs and private partners to deliver solutions that are scalable, sustainable and inclusive.
Our commitment to improved environmental performance is closely linked to our mission to connect and support communities. As we scale our operations across markets, we’re determined to limit our impact on the environment.
We’re candid about balancing our ambitious digital inclusion goals with the long-term environmental targets which require careful management. That’s why we’re deploying renewable energy solutions wherever feasible. In 2024/25, we continued to invest in solar-powered and hybrid network sites, intelligent cooling systems and moving off-grid sites to on-grid/hybrid energy solutions which reduce the costs of running these sites while minimising our impact on the environment.
We’re also taking action on e-waste management and circularity. In 2024/25, we recycled 93% of our total wasted generated across our operations, promoting responsible consumption in line with UN SDG 12.
SDG 4: Quality education
SDG 5: Gender equality
SDG 8: Decent work and economic growth
SDG 9: Industry, innovation and infrastructure
SDG 12: Responsible consumption and production
Schools connected to the internet
Total number of schools with free internet access
Aligned with: UN SDG4 Quality education and UN SDG9 Industry, innovation and infrastructure
Gender balance
Percentage of women across the Group
Aligned with: UN SDG5 Gender equality and UN SDG8 Decent work and economic growth
Waste management
Percentage of total generated waste recycled
Aligned with: UN SDG12 Responsible consumption and production
Investment in solar and hybrid sites
Number of sites migrated from off-grid to on-grid/hybrid
Aligned with: UN SDG12 Responsible consumption and production
Improving our sustainability profile with sustainability-linked loans
In 2024/25, we signed a sustainability-linked loan (SLL) with the International Finance Corporation (IFC) in two of our OpCos (the DRC and Rwanda) for a total of $135m. The structure of the loan includes target interest margin incentives on the achievement of specific social KPIs related to digital inclusion, financial inclusion and gender balance. These KPIs are aligned with our long-term sustainability strategy which underpins our business strategy focused on developing the infrastructure and services that will drive digital and financial inclusion for people across Africa.
This loan is in addition to our agreement with Citibank, signed in 2022, for a sustainability-linked loan which included targets related to digital inclusion and gender balance which span several Group subsidiaries.
Partnerships and collaborations
Aligned to the ethos of the UN Sustainable Development Goals (UN SDGs), we recognise that real impact comes through collaboration and partnership, with organisations working in unison to achieve the same goal.
We collaborate with governments, regulators, fintech providers, technology partners and local businesses to enhance connectivity, financial inclusion and sustainable development.
We work with more than 2,600 partners and suppliers across Africa, including mobile brands, IT companies and telecoms infrastructure providers – with the top 100 vendors and suppliers accounting for 87.2% of our procurement spend.
Airtel Africa has been a signatory of the UN Global Compact (UNGC) since April 2021 and we are committed to upholding its values and principles and using our participation as an opportunity to learn from other organisations. Similarly, we participate fully in our trade body, GSMA, to collaborate, share and learn from industry peers.