


Climate change is a material topic
Reduction of greenhouse gas (GHG) emissions
Our ambition is to achieve net zero greenhouse gas (GHG) emissions by 2050
Our near-term target is, by 2032, to reduce our scope 1 and 2 carbon emissions intensity by 62% from our baseline and continue rolling out robust engagement programmes with our partners and suppliers to reduce our scope 3 emissions.
Commitment to reducing our environmental impact
We are committed to continuing with our ambitious and comprehensive approach to minimising environmental impact by reducing the GHG emissions associated with our operations as well as contributing to a broader commitment across our supply chain. The decarbonisation strategy is embedded within our long-term commitment to sustainable growth, energy efficiency and digital inclusion in our 14 African markets.
Our operational focus remains on rolling out the initiatives which span from fundamental infrastructure upgrades, such as hybrid power solutions, to advanced energy management systems. However, we face challenges, such as underdeveloped power grids and weather-related events affecting power availability in the geographies where we operate. For example, recent droughts in Malawi and Zambia*, and severe floods in Kenya and Tanzania, impacted energy and hydroelectric power generation, triggering blackouts and disruptions in these markets.
As we continue to invest in our network resilience and availability, we factor in service continuity to meet our customers' needs even during challenging times while ensuring our impact on the environment is minimised as we expand our services in sub-Saharan Africa.
* Zambia sources up to 84% of its electricity from water reservoirs such as lakes and rivers (earth.org) and in Malawi 95% of electricity comes from hydroelectric power (www.energy.gov.mw)
Our journey towards a net zero future
In 2024/25, we published the latest update of 'Our journey towards a net zero future', which sets out the detailed roadmap to reduce GHG emissions across our operations and supply chain. The document outlines our strategic approach to decarbonisation, including the near-term target of a 62% reduction in scope 1 and 2 emissions intensity* by 2032. It also provides updates on energy efficiency measures, hybrid infrastructure deployment as well as our partner and supplier engagement programme to reduce scope 3 emissions in the value chain.
* tCO2e/MW of installed capacity
- For more information about our decarbonisation strategy, see ‘Our journey towards a net zero future’ published on www.airtel.africa
Governance
Our governance structure supports coordinated action across operations and supply chain in our 14 markets.
- Executive oversight: the Sustainability Committee, chaired by the CEO and comprising members of the executive leadership team, is responsible for the decarbonisation strategy and reviews performance every two months.
- Cross-functional implementation: the reduction of GHG emissions goal is jointly led by the chief technology officer (CTO), who also oversees service quality, and the chief supply chain officer (CSCO), who drives supply chain management. Operational execution is driven by network infrastructure and supply chain teams under the strategic direction of the CTO and CSCO.
- Two core policies: the environmental policy and the carbon accounting methodology provide the framework for emissions measurement, reduction strategies and alignment with international best practices. This policy-led approach sets out robust principles for GHG data integrity and outlines our ambition to achieve net zero by 2050 and manage environmental risks.
- Continuous reporting and review: progress is reported regularly to the Sustainability Committee to ensure alignment with our decarbonisation strategy and best practices for achieving our long-term net zero ambition.
This governance model ensures that climate accountability is embedded across our business, driving transparency, ownership and sustained progress toward our environmental commitments.
- For more information about our environmental policy and carbon accounting methodology, visit www.airtel.africa
GHG emissions footprint in 2024/25
134,021
tCO2e
scope 1 and 2 emissions
(+4.3% vs 2023/24)
448,050,273
MW
energy consumption
(+3.1% vs 2023/24)
14%
reduction in emissions intensity
(vs 2022 baseline)
19.6%
reduction of PUE in MSCs
(vs 2022 baseline)
Our emissions profile: scope 1, 2 and 3
Scope 1 and 2 emissions
These emissions come directly from owned assets and purchased energy. In 2024/25, our scope 1 and 2 emissions increased by 4.3% compared to the prior reporting year as external challenges impacted our ability to reduce emissions at the pace we had anticipated. These exceptional factors included a severe drought in Zambia which reduced the grid availability from 24 hours to six hours a day, resulting in a higher use of diesel generators to continue maintaining our service quality. In addition, in Malawi, we switched energy provision for sites previously operated by towercos resulting in reclassification of related emisisions from scope 3 to scope 1 and 2.
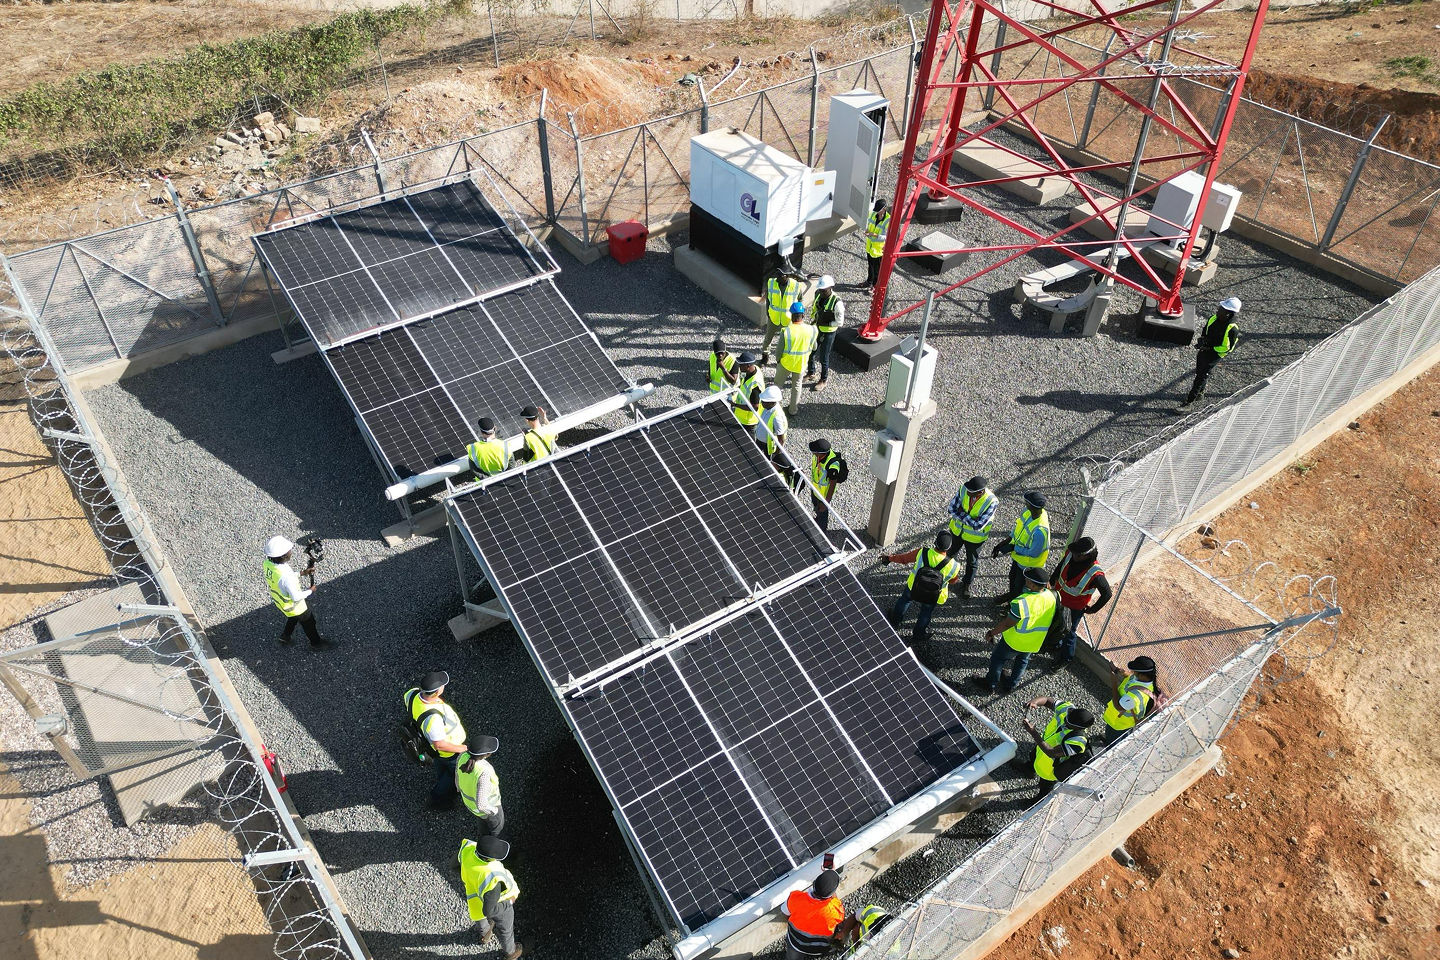
We continued rolling out specific measures which included the deployment of hybrid solutions (e.g., solar power, conversion from off-grid to on-grid, deployment of lithium ion batteries) at tower sites and mobile switching centers (MSCs) in our markets to directly reduce energy consumption and reliance on diesel generators.
Scope 3 emissions
For our scope 3 emissions data, which requires collection and verification from external partners, we’re only able to report this with a lag of one year to ensure our scope 3 data has been subjected to reasonable internal verification. This is in line with our internal processes to ensure our reported data is fully checked and verified.
- In 2023/24, representing 87% of the total GHG emissions footprint, our scope 3 emissions amounted to 891,182 tCO2e. These emissions are largely linked to leased assets and capital expenditure. This was in line with the prior year (88%)
- Within these emissions, approximately 68% arose from category 8 (upstream leased assets) which is due to our equipment hosted on leased tower sites. Furthermore, 22% of our scope 3 emissions related to our capital expenditure and form part of category 2 (capital goods)
- The remaining scope 3 emissions were split between other categories which constituted 9.7% of our total footprint
- Despite the significant growth of our network, in 2023/24 our scope 3 emissions increased by 4% from the prior year as we continue to engage with our partners to reduce their impact on the environment. Since our 2022 baseline, scope 3 emissions have increased by 12.5%, despite an 87% increase in data capacity on our network (TB/day).
Key projects and initiatives to improve energy efficiency and modernise infrastructure
Conversion to hybrid and renewable energy solutions
A major initiative of moving off-grid sites to on-grid, where feasible, took place in 2024/25. As of 31 March 2025, we converted 500 sites from off-grid to on-grid energy which has resulted in the saving of approximately 350,000 litres of fuel. For those that remain off-grid due to local infrastructure constraints, hybrid solutions involving solar panels and lithium-ion batteries are being considered to reduce diesel consumption.
Optimising data and mobile switching centers (MSCs)
We continue to focus on consolidating and right-sizing equipment, optimising physical space and enhancing the efficiency of cooling systems.
These operational improvements contribute to an ongoing reduction in power usage effectiveness (PUE)* over time which resulted in better energy efficiency and savings of 8,390,000 kWh during this reporting period.
Power usage effectiveness (PUE)
* Power usage effectiveness (PUE) or power unit efficiency is a ratio that describes energy efficiency.
Site-specific initiatives at tower sites
For tower sites operated or managed by Airtel Africa, the focus remains on off-grid to on-grid conversion, hybrid energy solutions and the installation of energy-saving equipment.
For tower sites managed by our partners, we continue to engage in driving positive environmental outcomes to reduce the impact on the environment which also includes solar/hybrid power improvements and energy efficient equipment. For example, the recent lease extension renewal with American Tower Corporation (ATC) included specific renewable energy targets to reduce the reliance on diesel fuel.
In markets where grid connection is limited or unstable (e.g., Nigeria and Zambia), diesel generators are being supplemented or replaced with renewable energy solutions.
ESCO model in Chad
A new approach for the rollout of an ESCO model is being tested in Chad, where an expert partner will supply energy to our sites, including hybrid or solar solutions to significantly cut down diesel use. Full deployment is anticipated in 2025/26.
Environmental and financial impact
A direct outcome of these initiatives is a reduction in both operational costs and carbon emissions, contributing to our long-term sustainability goals.
The improvements in energy efficiency at data centres contribute to a lower PUE, supporting both cost savings and reduced environmental impact.
The shift to renewable energy sources and improved energy management is aligned with our broader decarbonisation targets, including a net zero ambition by 2050.
Our decarbonisation strategy is projected to significantly decrease reliance on diesel and, in turn, contribute to the reduction of our scope 1 and 2 emissions.
Strategic integration and future roadmap
Baseline and progress tracking
The detailed breakdown of emissions since 2022 serves as a baseline for tracking progress against our sustainability targets.
Incremental gains are monitored through regular assessments and workshops with OpCos that contribute the most to the baseline emissions.
Extended scope and supply chain engagement
Beyond internal assets, our decarbonisation strategy extends to managing scope 3 emissions by engaging with towerco operators, partners and suppliers via our ‘Partners and suppliers engagement programme’ (PSEP), ensuring that external partners also contribute to reducing the overall carbon footprint and are fully aligned with our environmental and social standards.
We monitor our supply chain via the annual ESG self-assessment questionnaire (SAQ) as well as the annual ESG roundtable with top-tier partners chaired by the chief supply chain officer who is responsible for ongoing development and implementation of PSEP.
Innovation and adaptation
The continuous evolution of methodologies (e.g., revised energy consumption calculations using updated conversion factors) ensures that our approach remains robust and accurately reflects both energy use and emissions intensity.
Investment in energy-saving equipment and infrastructure modernisation is designed to support future growth while keeping environmental impacts in check.
Our medium- and long-term decarbonisation strategy integrates technological innovation, operational efficiency and collaborative partnerships. By focusing on converting off-grid assets to on-grid, deploying renewable energy, optimising operational processes and further engaging with external partners and suppliers for scope 3 emission management, we aim to achieve substantial reductions in GHG emissions intensity by 2032. These measures not only contribute to lowering our carbon footprint but also deliver financial and operational benefits, positioning Airtel Africa on a strong path toward our long-term net zero ambition.
This comprehensive approach serves as a robust framework for balancing sustainable growth with environmental stewardship, ensuring that the company’s operations remain resilient and environmentally responsible in the face of infrastructure challenges.
- For more information about our TCFD disclosures, see Annual Report and Accounts 2025 published on www.airtel.africa
Total scope 1 and 2 emissions in 2024/25
(tCO2e)
Scope 1
Scope 2
Emissions scope | Total emissions (tCO2e) |
|---|---|
Scope 1 | 89,870 |
Scope 2 | 44,151 |
Total | 134,021 |
Total scope 1 and 2 emissions by source in 2024/25
(tCO2e)
Diesel
Electricity
Other sources
Source | Total emissions (tCO2e) |
|---|---|
Diesel | 87,794 |
Electricity | 44,151 |
Other sources | 2,075 |
Total | 134,021 |
Total scope 1 and 2 emissions by activity in 2024/25
(tCO2e)
Owned towers
Data centres
Other assets
Assets | Total emissions (tCO2e) |
|---|---|
Owned towers | 64,033 |
Data centres (inc. MSCs) | 57,286 |
Other assets (buildings, shops, fleet) | 12,702 |
Total | 134,021 |
Total scope 1 and 2 emissions by region in 2024/25
(tCO2e)
Nigeria
East Africa
Francophone Africa
Regions | Total emissions (tCO2e) |
|---|---|
Nigeria | 31,716 |
East Africa | 34,869 |
Francophone Africa | 67,436 |
Total | 134,021 |
Reduction of greenhouse gas (GHG) emissions goal in action
Hybrid energy solutions in partnership with Helios Towers
In many parts of sub-Saharan Africa, grid reliability remains a significant challenge, particularly in rural areas where even grid-connected towers often rely on diesel generators for backup power. To address this, Airtel Africa is working with Helios Towers to migrate infrastructure to hybrid energy solutions across Tanzania, Madagascar and the Democratic Republic of the Congo. By expanding access to grid power and supplementing with renewable or hybrid technologies, this partnership reduces fuel consumption and improves the resilience of our mobile network. These changes are not only lower emissions but also enhance service stability in hard-to-reach communities.
As of 31 March 2025, hybrid power systems have been deployed across 29% of Helios Towers' sites leased to Airtel Africa across these countries – demonstrating how supply chain collaboration can help address both environmental and operational challenges in one of the world’s most energy-constrained regions.